The rule allows companies to choose from three different methodologies. While we see a favoured approach so far, there are technical considerations to make when selecting the right one.

Key Findings:
- Most companies are selecting Option A, as described below, for their preferred methodology, but there are technical considerations to make when choosing your approach.
- Larger companies have higher ratios as do companies in the Consumer Services and Industrials sectors.
- The median pay ratio for the FTSE 100 is 77:1 and for the FTSE 250 is 30:1.
Most public companies in the United Kingdom (U.K.) are disclosing their CEO pay ratio for the first time this year and approaches to doing so have varied. The rule requires companies with more than 250 U.K.-based employees and financial years starting on or after 1 January 2019 to calculate and publish the ratio of employee pay in each quartile (25th, 50th and 75th) to that of the CEO single figure in the Director’s Remuneration Report. Importantly, companies must also include an explanation of year-over-year changes and how the ratio relates to pay, rewards and progression practices.
Public companies have three choices when considering their calculation of employee total remuneration:
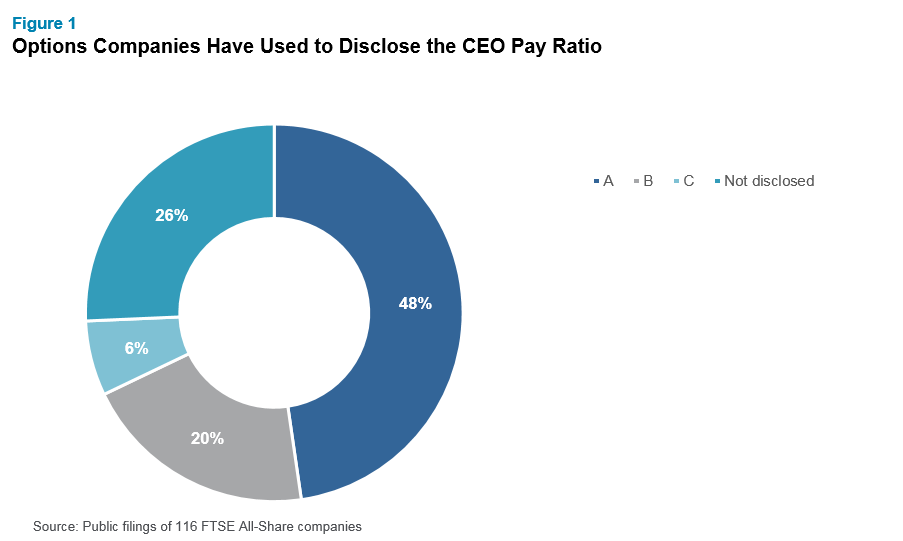
- Option A: The company must calculate a single figure for of all its U.K. employees for the relevant financial year in order to identify the employee whose pay and benefits are at the 25th, 50th and 75th percentiles. This is the option that most investors favour.
- Option B: The company uses the most recent hourly rate from their gender pay gap information to determine those employees at the 25th, 50th and 75th percentile and then calculates a single figure for those three individuals.
- Option C: This is similar to Option B, but uses additional data alongside, or instead of, the gender pay gap data to determine the three individuals before calculating their single figures (e.g., combining gender pay gap data with bonus and long-term incentive data or using just salary data).
As at 29 August 2019, 116 FTSE All-Share companies, the majority of these being FTSE 100 companies, have reported, with 18 companies only reporting the median. Figure 1 below shows the preferred methodology for those companies that have disclosed, with Option A being the preferred approach so far.
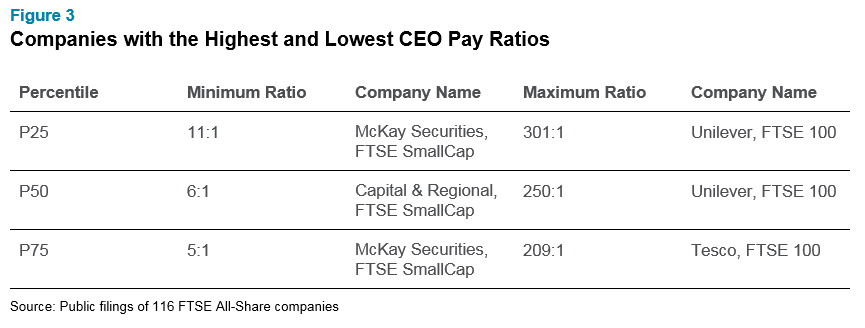
The highest CEO pay ratios are among the largest companies where CEO remuneration is often higher than at smaller organisations along with headcount. The median ratio ranges from 6 to 813 with a median of 77 for the FTSE 100, 30 for the FTSE 250 and 27 for the FTSE SmallCap.

Figure 3 shows the companies with the highest and lowest CEO pay ratios to-date, which also fall along company size.
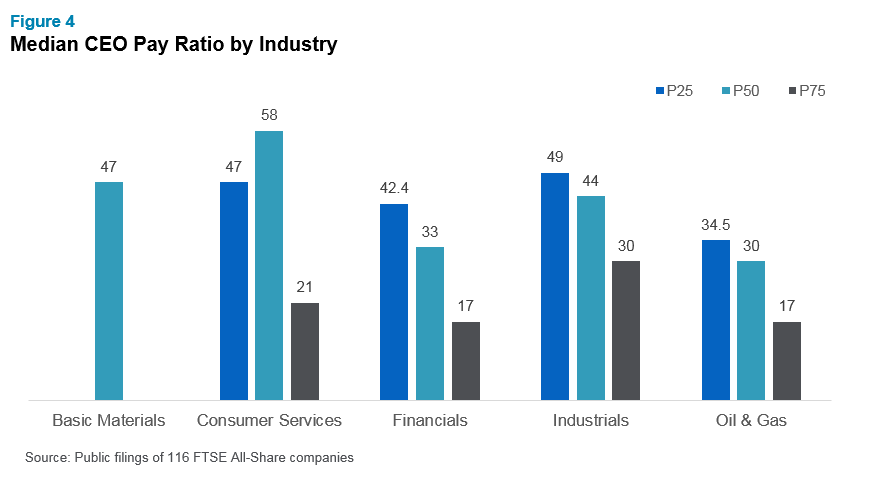
When we examine median ratios across different sectors, we find that the highest ratios are in consumer services and industrials. (Note, we have excluded sectors where there are less than five data points.) Not all companies in the consumer services sector disclosed the ratio for all the quartiles and companies in the basic materials sector only disclosed the median ratio.
Challenges Companies Are Facing
The first challenge faced by many companies is assimilating all the pay data required. Most companies use different systems to record salary, overtime, benefits, annual bonus and various share schemes, and find the compilation of data to be the most time-consuming element of the disclosure requirement.
Another pressing challenge is how to treat unique situations across your workforce. Some of the situations that can confound companies include:
- How should you treat those on maternity or long-term sick leave?
- How should overtime be factored in?
- How should the pay of those who joined partway through the year be calculated?
- How are recruitment awards and long service awards to be treated?
- How are SAYE awards to be treated?
Next Steps
There isn’t an easy and clear-cut answer to situations like those illustrated above. But in working with an adviser, companies can work through the solution that best meets their needs. If you are looking for assistance in calculating and disclosing your CEO pay ratio or want to speak to a member of our rewards consulting group, please write to rewards-solutions@aon.com.
Related Articles