Given strong growth in the technology sector, the London pay premium has become larger. The latest data underscores the importance of understanding regional pay and talent markets.

The technology sector in the United Kingdom (UK) is very much in high-growth mode, despite the looming uncertainty of Brexit, and as a result, we’ve seen pay premiums in the Inner London region increase compared to other regions in the country. The higher rate of wage increases in Inner London makes sense when looking at where technology growth has been concentrated. In 2017, a record amount of venture capital funding flooded into UK technology startups, but 80% of the nearly £3bn in funding went to London-based firms, according to London & Partners.
Most people involved in the technology sector would assume that London commands a pay premium compared to the rest of the UK. However, understanding just how much of a pay premium, and where the trend lines are headed, is important for any HR and compensation professional involved in the UK technology sector (or general industry businesses competing for technical talent). Looking at regional pay markets provides a full picture of compensation markets and powerful geographic differentials that might exist within a country. Benchmarking pay to determine the competitive job market in countries with especially powerful economic or industrial hubs— as is the case with London— requires thoughtful consideration of selecting the right companies to go in your market comparator group. These zones are extremely expensive for residents to live in, and simultaneously rich in talent-hungry companies. The combination of these forces ratchets up pay and can adversely impact the usefulness of country-wide data.
We used data from the Radford Global Technology Survey to find that technology sector employees located in Inner London receive salaries that are, on average, 16% ahead of the overall UK market. That’s slightly higher than the 15% premium we reported in January 2017 and significantly higher than the 12% premium we wrote about in May 2014. However, with a high percentage of technology employees in the UK working in London, it is even more revealing to look at how pay for London compares to other regions in the country rather than the average of the whole country. When taking this view of the data, regional disparities in pay become even more pronounced as seen in the chart below.
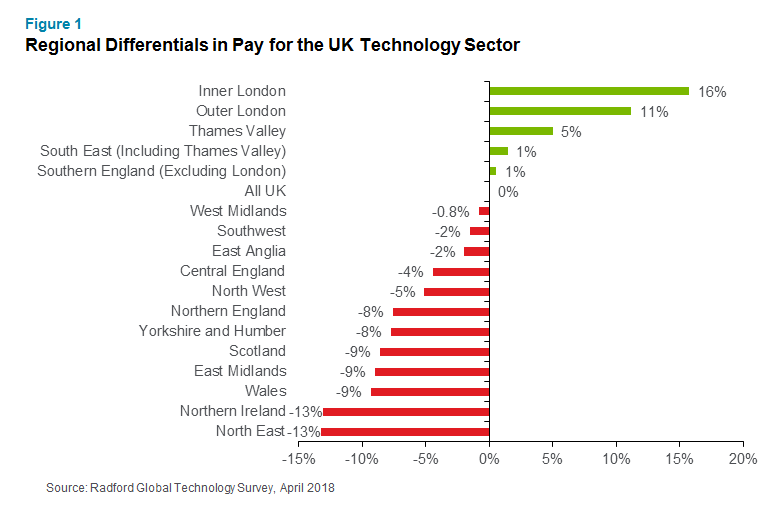
Geographic differentials in pay can range from relatively minor rounding errors to data points with significant potential to drive pay and business strategy. Taking a comprehensive view of regional differences in compensation across an entire country provides proper perspective on which data points should influence program design. In our opinion, differentials in pay approaching +/- 10% serve as a useful dividing line for when to seriously consider regionally targeted approaches to compensation. With this threshold in mind, it is clear that managing technology talent in the UK requires a fairly nuanced strategy.
Another approach for considering regional differences in pay is to examine the hypothetical "discount" achieved by transplanting talent from expensive to inexpensive regions. We use the term hypothetical because moves of this nature are often easier said than done. Looking at discount rates makes a lot of sense when opening a new office (assuming the right talent pool is available in your desired location), but it’s quite another endeavor to pick up an existing office and move it.
Figure 2 illustrates discount rates across our 17 UK regions as well as the UK average. We used Inner London as a baseline (set to 100%) for technology talent.
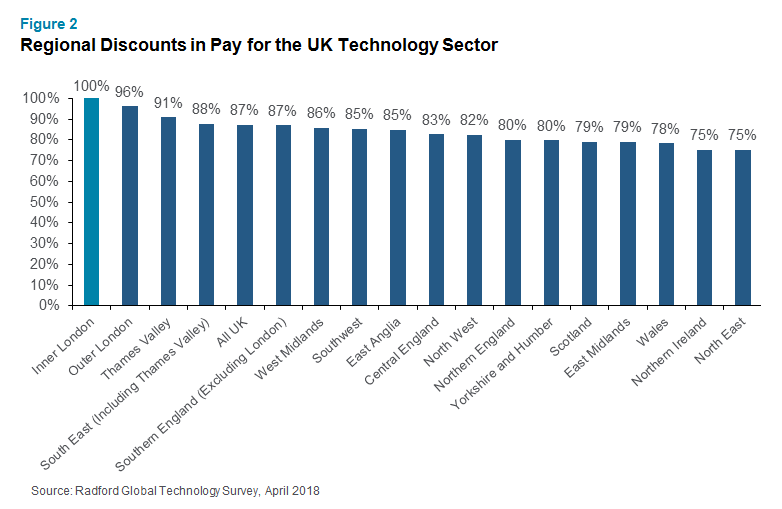
Examining discount rates can reveal meaningful opportunities for labor cost differentiation, especially when some locations outside of Inner London carry technology talent discount rates in excess of 20%. However, using these differential figures with additional data points— like voluntary employee turnover rates in excess of 10%— could suggest taking more proactive steps to hire and retain talent, particularly for certain in-demand jobs or positions where turnover has been highest. And in the UK, voluntary turnover among technology companies stands at 12.1% as of Q1 2018.
Compared to January 2017, the pay gap between Inner London and the following select regions in Figure 3 has grown over the past 15 months.
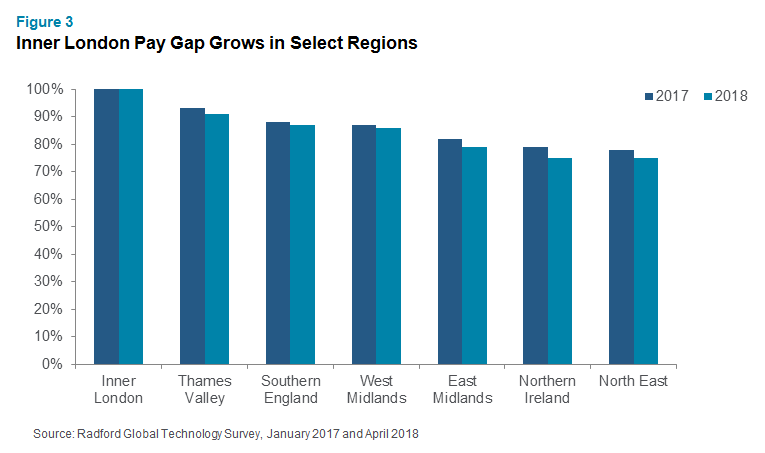
This suggests that wage growth in London’s technology sector is surpassing these regions. While we did find the pay premium in Inner London is getting slightly smaller in some regions, on average, the pay gap is growing larger and in more regions than it is getting smaller.
To learn more about participating in a Radford survey, please contact our team. To speak with a member of our compensation consulting group, please write to consulting@radford.com.
Related Articles