Following up on research from 2014, we revisit regional pay differences among UK technology companies and find the premium commanded in London is stronger than ever.

When benchmarking pay to determine the competitive job market in countries that have especially powerful economic or industrial hubs — large capitals like London in the United Kingdom (UK) and global talent magnets like Silicon Valley in the United States— requires thoughtful consideration of selecting the right companies to go in your market comparator group. These zones are extremely expensive for residents to live in, and simultaneously rich in talent-hungry companies. The combination of these forces ratchets up pay and can adversely impact the usefulness of country-wide data.
At Radford, we often combat the influence of expensive technology and biotech hubs by diving deeply into our survey data to provide clients with regional analyses. While we don’t typically recommend using granular cuts of data to create comparator groups for broad-based employees, in certain circumstances it makes sense. Looking at regional pay markets gives compensation professionals the full picture of compensation markets and powerful "geographic differentials" that might exist within a country. To illustrate this point, our team reviewed data from Radford's Global Technology Survey to evaluate differences in base salaries across 17 UK regions.
With data for the entire UK serving as a baseline of zero, we discovered that technology sector employees located in Inner London receive salaries that are, on average, 15% ahead of the overall UK market. However, with a high percentage of technology employees in the UK working in London, it is even more revealing to look at how pay for London compares to other regions in the country rather than the average of the whole country. When taking this view of the data, regional disparities in pay become even more pronounced as seen in the chart below.
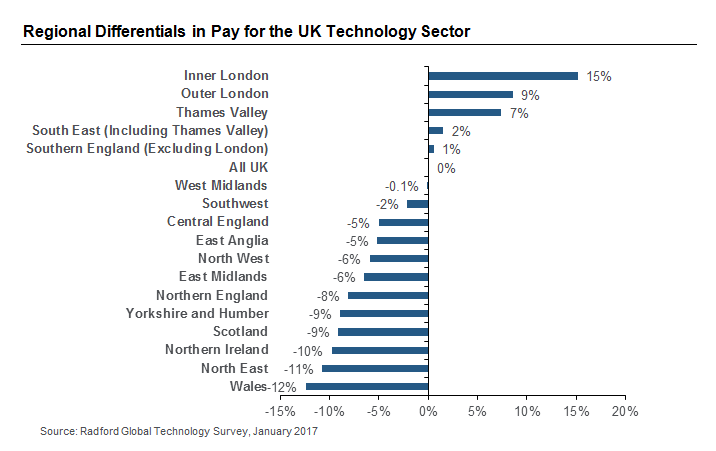
We took a close look at regional pay differentials in the UK technology market nearly three years ago. While we haven’t seen significant swings in differentials since then, London continues to command a premium. In 2014, we looked at London as a whole and found an average 12% premium to the UK national average. By dividing London between inner and outer areas, we find meaningful pay differences within the city itself.
As the above chart illustrates, geographic differentials in pay can range in scale from relatively minor rounding errors to data points with significant potential to drive pay and business strategy. Taking a comprehensive view of regional differences in compensation across an entire country provides proper perspective on which data points should influence program design. In our opinion, differentials in pay approaching +/- 10% serve as a useful dividing line for when to seriously consider regionally targeted approaches to compensation. With this threshold in mind, it is clear that managing technology talent in the UK requires a fairly nuanced strategy.
Another approach for considering regional differences in pay is to examine the hypothetical "discount" achieved by transplanting talent from expensive to inexpensive regions. We use the term hypothetical because moves of this nature are often easier said than done. Looking at discount rates makes a lot of sense when opening a new office (assuming the right talent pool is available in your desired location), but it’s quite another endeavor to pick up an existing office and move it.
In the following chart, we illustrate discount rates across our 17 UK regions, using Inner London as a baseline (set to 100%) for technology talent.
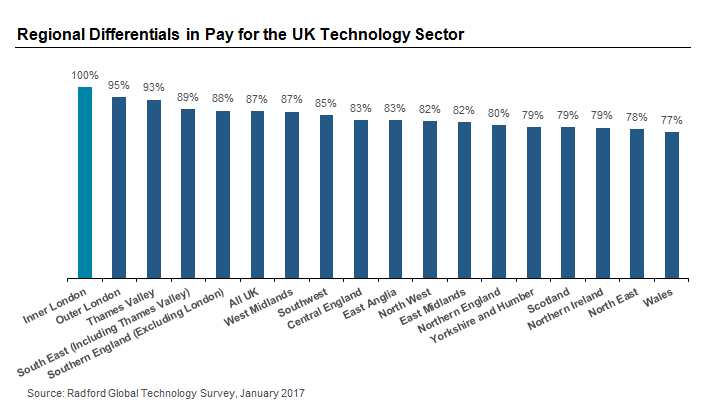
As the above chart illustrates, discount rates between Inner London and several UK regions are within a range of +/- 10%, which may not be enough in its own right to justify exchanging London for another UK location. This is especially true when factors like access to talent, partners, suppliers and logistics are considered. Nevertheless, examining discount rates can reveal meaningful opportunities for labor cost differentiation, especially when some locations outside of Inner London carry technology talent discount rates in excess of 20%. However, using these differential figures with additional data points, like voluntary employee turnover rates in excess of 10% could suggest taking more proactive steps to hire and retain talent, particularly for certain in-demand jobs or positions where turnover has been highest.
To learn more about participating in a Radford survey, please contact our team. To speak with a member of our compensation consulting group, please write to consulting@radford.com.
Related Articles