Introduction

With unemployment rates hovering around 5.5%, the broader labor market in the United States (US) continues to inch closer to a full recovery from the Great Recession of 2008-09. Labor conditions inside the technology sector are even more robust: voluntary turnover is rising and the competition for all forms of skilled talent, including engineers, sales reps, UI/UX designers and product marketers, is fierce.
As a result, technology firms are increasingly reliant on a variety of compensation vehicles to attract new talent to their growing workforces, including sign-on bonuses, increased starting salaries and new-hire long-term incentive grants.
The results of increased competition are evident across our business. Our consultants face frequent questions about the pace with which salaries are changing, as well as numerous inquiries on the many new benefits programs employed by companies to lure in talent. Similarly, results from the Radford Global Technology Survey continue to show steady increases in wages for nearly all jobs.
Beyond salaries, it is important to benchmark equity compensation as well. Yet, simply benchmarking the size of new-hire awards does not tell the full story. Individual new-hire equity activity is often driven by case-by-case factors, so a "big picture" view is important to consider. Significant structural changes are afoot, and to truly understand the pace of change in new-hire equity awards, it is important to consider a less visible metric: the ratio of new-hire equity award sizes to ongoing equity award sizes.
A Brief History Lesson
As stock markets ascend, employees who hold stock begin to have more and more skin in the game—strengthening their pay-for-performance link and providing an increased retentive benefit to their current employers. In this type of environment, the task of attracting the best possible new employees becomes more difficult, as new-hire equity awards have to replace a growing stockpile of unvested equity value. Out of simple necessity, the size of new-hire awards increase and new-hire grants relative to ongoing equity awards, especially for key jobs, begins to rise.
In the late 1990s, as the US economy accelerated into the dot-com era, the ratio of new-hire to ongoing employee equity grants was roughly 3:1. Technology companies were flush with shares and eager to hire candidates with highly sought-after skills. However, after the dot-com bubble burst and stricter equity compensation accounting rules were put into place, technology companies began to use less equity as they migrated away from stock options to restricted stock, pushing the ratio down to 2:1 or lower.
By the time the Great Recession arrived, the historic highs of the late 1990s seemed like a distant impossibility, suggesting that the ratio of new-hire to ongoing equity grants would never again hit 3:1. Of course, as we are about to explore in this article, a lot has changed in the past five years.
Grant Ratios Are Climbing
Human resources leaders need to be keenly aware of how their new-hire and ongoing (or annual) equity practices compare to each other and the market. Companies should maintain a realistic internal ratio while also remaining competitive in an aggressive talent market. If companies fail to meet market demands, they will be at a recruiting disadvantage. At the same time, as the internal ratio of new-hire equity award sizes to ongoing equity award sizes increases, companies risk creating severe disconnects in pay between new and tenured employees. This could lead to reduced morale, internal pay equity issues, and the accelerated loss of tenured employees.
To determine how the ratio of new-hire equity award sizes to ongoing equity award sizes has changed over the years, the Radford Global Technology Survey team examined data from more than 1,000 US technology companies, spanning all key industries — including hardware, software, semiconductor and medical device firms. We then looked at actual equity grants for new hires and ongoing annual grants for incumbent employees in 2010, 2012 and 2015, separating the data into key employee cohorts as follows: manager-level (Radford levels M1 through M6) employees and professional individual contributor-level (Radford levels P1 through P6) employees in technical/engineering vs. non-technical roles. Using incumbent-weighted averages at the market 50th percentile, we find that ratios are increasing across all studied cohorts.
In our first chart below, we illustrate the acceleration of ratios for professional individual contributors (Radford levels P1 through P6) over the last five years:
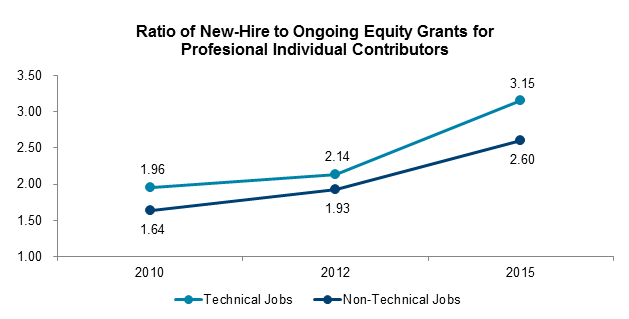
The chart shown above indicates that the ratio of new-hire to ongoing equity award sizes has increased for both technical/engineering and non-technical jobs in the professional individual contributor ranks. This means new employees are receiving much larger initial equity grants as part of their long-term incentive package as compared to ongoing employees' long-term incentive awards today. The ratio is even higher for technical jobs — breaking the 3:1 mark — and has accelerated at a greater pace since 2012. This suggests that while the overall demand for top talent at technology companies is very high, filling technical job positions, such as software and hardware engineers, is a major talent acquisition challenge. In order to attract new employees, businesses are offering far greater amounts of long-term equity up front in the form of stock options and restricted stock.
In our next chart below, we illustrate the acceleration of ratios for manager-level employees (Radford levels M1 through M6) over the last five years:
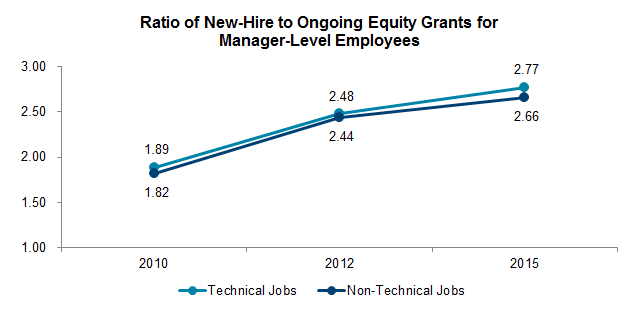
The chart shown above illustrates a similar trend line for technical and non-technical management roles. Again, companies are awarding larger equity awards to their new hires compared to continuing employees over the past five years. However, of note, the difference in the ratio of new-hire to ongoing equity award sizes for technical and non-technical staff in a management role is less pronounced. There is no meaningful premium for technical talent. We are not surprised by this last finding. Skilled individual contributors in technical positions are in extreme demand at technology firms and have "hot skills" found among a very limited population, while managers — whether they are overseeing a technical or non-technical function — are hired based on a more generic skill set: their management experience.
Conclusion
Most compensation metrics have inched upward in the technology sector over the past five years, particularly in industries with more acute skills shortages like software. However, analyzing less known frequently referenced metrics, like the ratio between equity grants for recently-hired vs. longer-tenured employees, is an excellent method for monitoring the degree to which new-hire packages are keeping pace with an over-heated talent market.
This reality bears out for managers and individual contributors alike, in both technical and non-technical positions; however, technical professionals (Radford levels P1 through P6) seem to be leading the race for increased new hire equity packages.
As we stated in the introduction, this phenomenon occurs periodically throughout time and has typically waxed and waned with macroeconomic conditions in the broader economy and in the technology industry. We expect at some point in time this ratio will go down once more. In the meantime, it's important for compensation managers to be aware of increased pressure on new-hire packages. Yet, the all-out race for talent doesn't come without a word of caution for human resources leaders: companies need to be careful that they do not alienate tenured employees by offering newer recruits outrageous equity packages. As with all aspects of compensation, employee communication, balance and managing expectations are critical for success.
To learn more about participating in a Radford survey, please contact our team. To speak with a member of our compensation consulting group, please write to consulting@radford.com.
Related Articles