
Introduction
The movement to align corporate performance plans with total shareholder return (TSR) has been so rapid, it's easy to forget that these plans only came into existence in the US around 2005. Furthermore, it was the advent of mandated say-on-pay voting in 2011 that truly made relative TSR plans pervasive. On the grand timeline of compensation and governance trends in the US, relative TSR plans are still a relatively new arrival.
However, in the UK and other parts of Europe, pay-for-performance plans tied to absolute or relative TSR metrics arrived much earlier. This means US companies can draw important lessons from companies across the Atlantic, where plan design methodologies have had far longer to mature. In Europe, firms have already experimented with, improved on and discarded numerous practices related to peer group design, grant date timing, communication, plan management and cost reduction techniques.
In-Market Influencers of Plan Design
In both the US and UK, there are a number of outside groups that influence the design of performance equity plans. In the US, these groups consist primarily of proxy advisory firms (e.g., Institutional Shareholder Services and Glass Lewis), and a few significant institutional shareholders with strong corporate governance policies (e.g., BlackRock, CalPERS, CalSTRS, and Fidelity). In the UK, the three most influential organizations impacting performance equity plan design include the Association of British Insurers (ABI), Research Recommendations and Electronic Voting and Institutional Shareholder Services (RREV/ISS), and the National Association of Pension Funds (NAPF). In particular, both the ABI and RREV/ISS tend to have a big impact on proxy voting results at British companies through their detailed reports on executive compensation practices.
In both markets, groups of this nature can have a significant influence on equity compensation strategy, typically by demanding a stronger emphasis on pay-for-performance and reduced shareholder dilution rates. For example, Radford research shows that support levels for say-on-pay votes at technology and life sciences companies where ISS issued a no-vote recommendation dropped by an average of 30.2 percentage points and 31.9 percentage points, respectively, in 2014.
At the moment, outside influencers in the UK are generally focused on a few key plan design nuances in the hopes that they can force companies to further optimize links between pay and performance. Whereas in the US, shareholders and proxy advisor firms are still advocating for broader adoption of relative TSR metrics and performance equity plans, and are less concerned about the finer details of plan design.
Relative TSR Plan Types
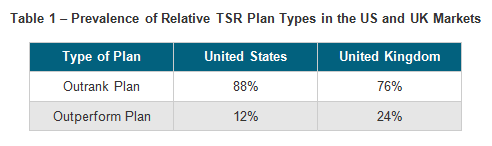
Whenever a company initially implements a relative TSR plan, one of the first decisions plan designers must make is to determine how the company will be measured vs. its peers. There are two general approaches in the marketplace to address this question: "Outrank" and "Outperform" plans.
Outrank plans determine the payout ultimately earned by ranking a company's TSR against the shareholder return of a defined peer group (e.g. 200% of target is earned if the company's TSR is at the 75th percentile against the peer group). On the other hand, outperform plans determine the payout based on the magnitude of outperformance or underperformance against a benchmark TSR level (e.g. 200% of target is earned if the company's TSR exceeds the index TSR by 25 percentage points).
Both plan design options exist in the UK and the US, with Outrank plans serving as the most common choice in both markets by a large margin. However, Outperform plans are twice as prevalent in the UK vs. the US, where their market share has plateaued at 24%. In the US, the prevalence of Outperform plans is rising steadily and could conceivably reach a quarter of the market in the years ahead.
Peer Group Development Practices
After determining a plan type, the next step in the process of designing a relative TSR plan is to determine the peer group against which the company will be compared. This is one of the most important aspects of designing a relative TSR plan. Poorly selected peers can introduce a substantial amount of market volatility into the plan and make employees feel discontented with potential payout outcomes.
In the US, most companies rely on custom peer groups, despite the fact that indices (e.g., the S&P 500) are easier to use. The number of plans using custom groups is growing as well, as companies try to fine-tune their plans. As plans become more mature in the US, the focus continues to be on smaller custom groups to make sure peers are as representative of the company as possible.
Meanwhile, despite the fact that relative TSR plans in the UK have been in use longer and are generally more advanced than the US, when it comes to peer group selection practices, UK companies typically opt for the simple choice. They rely heavily on indices (e.g., the FTSE 100 or the FTSE 250). The reason for this approach is likely driven by the fact that UK companies face a very limited supply of companies to compare themselves against. Building a size- and industry-specific peer group of sufficient scale is far more difficult in the UK.
To build custom peer groups, companies typically start by looking at factors such as industry, sector, revenue and business size (i.e., headcount or operational scale) to identify potential peers. As a result, many US companies initially adopt performance peer groups that closely mirror their compensation peers. However, stock price performance peers should not necessarily be the same as compensation peers— certainly, some overlap is expected, but perfect alignment can be problematic. The standard, subjective approach to selecting peers is just a starting point when it comes to relative TSR plans.
In the UK, companies often use a more objective approach to help identify true performance peer companies, such as comparisons of historical TSR performance, stock price volatility, and stock price correlation, which measures the relationship of one company's price movements to another. While these measures should never be the sole determinant of a peer group, they introduce a new level of rigor into the selection process. It should be noted that some US companies are starting to incorporate these practices, but analyses of this type are not widespread. Finally, companies in both markets sometimes need to account for international or offshore peers. Handling foreign exchange issues creates a whole new set of complexities for relative TSR plans, but facing these challenges is increasingly necessary as business becomes more globally connected. UK companies already tend to have peer groups with an international flavor, given the close proximity of comparable companies in so many other countries. Whereas only a handful of US firms are beginning to incorporate peer companies that trade in foreign currencies.
Payout Schedule Practices
The next step in the design phase of a performance equity plan with relative TSR metrics involves building a payout schedule: determining what payouts will be awarded at different performance levels.
Most US plans allow for above-target upside, with maximum payouts landing somewhere between 150% and 200% of target. US plans usually also allow for some level of payouts for below-target performance. This line of thinking is rooted in the belief that employees deserve extra credit for outperformance, but also deserve some degree of compensation for slightly less than optimal performance as a retention tool.
Culturally this makes sense, as US companies are more likely to intentionally seek a balance between pushing for peak performance while providing incentive programs with a measure of downside security to protect against the risks that are often associated with seeking significantly above-target goals.
In the UK, plans are structured very differently. Maximum payouts rarely exceed 100% of target grants, and no payout can be earned for performance below median or benchmark performance thresholds. In contrast to the US, the message to UK award recipients is that "target performance" is the true goal, and that accepting outsized risks to accelerate beyond target goals should be avoided — the rewards do not justify the risks. The widespread use of this model in the UK is an example of how advisory and governance groups in the country have heavily influenced plan design choices. See the tables below for sample payout schedules in both countries.

Importantly, the contrasting styles in the US and the UK do not necessarily mean that UK award recipients receive below-market rewards potential. Maximum payouts in the UK may not exceed 100%, but target amounts are usually set higher relative to the US. In the end, maximum payout opportunities are often similar in both markets, making plan design differences between the US and UK more of a contrast in optics and communications styles. UK companies prefer to have lower fair values communicated to employees as the result of having no upside, whereas US plans prefer to incentivize outperformance.
In our opinion, there is merit to considering the UK approach in the US. Due to the model used by many US companies, some executives struggle to appreciate the value of relative TSR awards because their fair value often exceeds the value of the stock price. For this reason, we expect US firms to gradually migrate to the UK model.
Percentile Rank Calculation Practices
Once a general payout schedule is established the next design nuance to consider for Outrank plans is the selection of a percentile rank calculation. The primary choices in this area are the "Discrete" and "Continuous" percentile rank methodologies. The discrete method uses a company's exact position within a peer group to establish its percentile rank, while the continuous method interpolates a company's position between its two closest peers to establish percentile rank. Differences between the methodologies are usually de minimus when using very large peer groups. However, as peer groups decrease in size, differences between discrete and continuous calculations can intensify.
Given this dynamic, companies in the UK tend to favor the continuous percentile rank methodology because their peer groups tend to be smaller. US firms take the opposite approach, typically using the discrete percentile rank methodology because their peer groups tend to be larger. This may seem counterintuitive at first, given that US plans use custom groups more often than in the UK, where indices are preferred. The reality is that even with the wide use of indices in the UK (e.g., FTSE 100), custom peer groups in the US can still be larger, and indices used in the US are much, much larger (e.g., S&P 500 and Russell 2000). Over time, as US companies trend toward smaller, more relevant peer groups pursuant to investor pressure, we expect more US firms to migrate to the continuous percentile rank methodology.
TSR Calculation Practices
One critical, and often overlooked, nuance of relative TSR plans is how to incorporate dividends into the calculation of TSR. A number of valid methods exist to handle this issue. Yet, surprisingly, the UK and the US have evolved to adopt a common best practice.
To be specific, this practice involves calculating TSR by reinvesting dividends issued throughout the performance period at the closing price on the ex-dividend date to acquire more shares. These shares are accumulated over the period and weighted against the company's value to create daily "asset values" for the stock. The daily values are then averaged to create the beginning and ending average prices for the calculation of TSR, which includes the impact of dividends. It's worth noting that there is more variability in the specific details of the calculations used in the US than those in the UK; however, the fact that both nations agree on the predominant methodology might indicate something about the methodology's validity. This may also be a sign that US plans are evolving faster than expected.
Another important aspect of TSR calculations to consider during the design process is the length of the averaging period. In both markets, companies use averaging periods to hedge against random market fluctuations, and hopefully to smooth out the stock price around the start and end points of the performance period. In the US, most plans tend to use averaging periods that are one calendar month or twenty trading days. Conversely, in the UK, averaging periods tend to be slightly longer, averaging three months in length. A longer averaging period will remove more market fluctuation from the calculation, but there is no empirical evidence to suggest that one is better than the other. Overall, the key takeaway is that both countries are using averaging periods in an effort to remove the impact of market movements.
Grant Timing Practices
When it comes to grant timing, the devil is truly in the details. Companies need to pay careful attention to the relationship between the actual grant date of awards and the start of performance periods, which are not always the same day. Under accounting rules in both markets (ASC Topic 718 in the US and IFRS 2 in the UK), all known information as of the grant date must be included in the fair value of an award.
For example, if the performance or TSR measurement period has already started at the time of the grant, relative TSR performance in that gap period must be incorporated into the fair value of the grant. As a result, if the company is outperforming its peers over this period, they are starting from an advantageous position at the date of grant, and, therefore it can become more likely in the simulation model that further outperformance will occur, raising the fair value. Conversely, if the company is behind its peers over this gap period, it is likely that further underperformance will occur, lowering the fair value. The impact these possibilities will actually have on award valuations depends on the level of out- or underperformance a company experiences in the gap period, and the overall length of any gap (i.e., 1 day vs. 90 days).
In the US, many companies were initially unaware of this nuance and aligned performance periods with their fiscal year start (e.g. January 1), and then made grants much later during normal reward cycles (e.g. March 15). As plans have matured over the years, a growing number of companies addressed the issue to minimize potential impacts on fair value. In the UK, several companies are expected to align their performance periods with their fiscal years due to new UK Government reporting regulations (see BIS Remuneration Report Regulations summary here). Although this isn't a specific requirement, it allows companies to align reporting figures more easily and provides greater continuity.
Cutting Edge Design Features
Two new design considerations have emerged in relative TSR plans over the years that not only help to mitigate accounting costs, but also place very reasonable governance controls on payouts. The first is a negative, or absolute, TSR threshold, which limits award payouts if the company's TSR is negative. This aligns very well with shareholders, as payouts are restricted if there is no return to shareholders. Additionally, this design approach can provide a reduction in fair value in certain instances. About 26% of US plans use negative, or absolute, TSR thresholds. Interestingly, the original reason for the adoption of this modifier was to mollify shareholders, but increasingly, the focus is on reducing the cost of equity plans.
On the other hand, UK plans tend to give Remuneration Committees discretion to scale back awards when they believe vesting percentages do not represent the true financial performance of the company. This discretion is not factored into fair value calculations and therefore has no impact on the cost of equity plans. It is a best practice recommendation in the UK rather than a cost-saving exercise.
Another innovative design element is called a Total Value Cap, which limits the monetary value an employee can walk away with via any given award. Total value caps are commonly set to 500%, meaning an employee cannot earn more than 500% of the target value on the date of grant. This modifier serves as a governance control to limit windfall payouts due to extreme stock price performance. However, it can also provide drastic reductions in fair value without impacting the perceived value of awards on the part of employees, as the cap may be deemed unlikely to come into play. In fact, in the four years since this nuance first appeared, Radford has rarely observed a hit against the total value cap. While just over 2% of US plans contain this design element, that number represents a growth in the frequency of total value caps in the past three years. As with negative TSR thresholds, the focus here is on governance controls and reducing account costs. It should be noted that plans in the UK with a total value cap are very rare and there is currently no sign of them becoming more popular.
Conclusion
Although equity plans with absolute and relative TSR metrics are on the rise in both the US and UK, there are noticeable differences in plan design practices across the Atlantic. In some cases, these differences are driven by culture, and in others, they are driven by a lack of experience in the US market relative to the UK. Yet as adoption rates increase in the US, proxy advisory firms continue to weigh in, and companies focus more on controlling costs, we expect US firms to eventually adopt a plan design style similar to that observed in the UK. With that said, in certain areas, US plans are more innovative (e.g., the use of negative TSR thresholds and total value caps), and it is unclear if UK companies will meet their US counterparts in the middle.
To learn more about participating in a Radford survey, please contact our team. To speak with a member of our compensation consulting group, please write to consulting@radford.com.
Related Articles